1 Introduction
At the end of August 2011, Hurricane Irene struck the East Coast of the United States, battering the country from North Carolina’s Outer Banks to Vermont. To give a small example of Irene’s power and the havoc she wreaked, there were as many as 1,045 downed trees and limbs in Boston, Massachusetts, alone, one of which is pictured in Figure 1.1. This is the same amount as the city would see in a typical year.
Wait. How do we know this? It turns out that the City of Boston has a 311 system by which people can report issues to public agencies. These 1,045 “tree emergencies” were received by the 311 system and relayed to the Parks & Recreation Department for fixing. The system does so by generating a database cataloging every report that it receives and then sending each to the appropriate agency. On the day Irene struck, 311 also received reports about downed streetlights and signs and requests for highway maintenance, which were forwarded to the Public Works Department and the Department of Transportation, respectively.
Figure 1.1: One of the many knocked down by Hurricane Irene in Boston, this one in the South End neighborhood (left) and a density plot of which parts of the city had more and fewer tree emergencies following the hurricane, as reported to 311 (right). (Credit: Boston.com; Author)
The power of a database is more than just being able to relay information to agencies, however. In retrospect, it becomes a digital record of the damage that Irene wrought on the city and its infrastructure, one that we can learn a lot from. By making maps, like the one on the right side of Figure 1.1, we see that tree emergencies came from across the city, though were more common in some places, including coastal areas exposed to the strongest winds. We can even watch in this video (also captured in Figure 1.2) how different that day truly was from the rest of the year.
 comparing this day to the rest of the year. (Credit: Author)](Chapter%201%20-%20Introduction/Figure%202a%20-%20Tree%20Video%20Pre.jpg)
 comparing this day to the rest of the year. (Credit: Author)](Chapter%201%20-%20Introduction/Figure%202b%20-%20Tree%20Video%20Post.jpg)
Figure 1.2: Though the City of Boston’s 311 system typically receives only a handful of tree emergency reports daily (top), Hurricane Irene was no average day, generating 1,045 such reports (bottom). You can also watch the full video comparing this day to the rest of the year. (Credit: Author)
Hurricane Irene is just one (rather dramatic) example of how 311 systems enlist constituents in the maintenance of public spaces and infrastructure. Everyday examples include people reporting potholes, cracks in the sidewalk, and graffiti tags. While more mundane, these are no less important to upkeeping the city and its many communities. And we can learn from these records, too. What types of challenges does each community face? How often? Can we better understand and even anticipate their needs? Can we evaluate and improve the effectiveness of the government agencies responsible for addressing these needs? All of these lessons can and have been learned by cities through the data generated by 311 systems.
For me, 311 is the iconic illustration of urban informatics. Urban informatics is a relatively young discipline, coming of age with the vast proliferation of digital tools for collecting, organizing, and analyzing data over the last decade. We might define it as the use of digital technology and data to better understand and serve communities. Whereas 311 can help us better understand communities and their needs, there is a broad range of other systems and databases—from education records to crime reports to Yelp reviews to Craigslist postings to library card transactions to traffic cameras—that can help us to answer questions and design innovative solutions. This is the promise and potential of urban informatics. Importantly, despite the word “urban” in the name, the tools associated with urban informatics can be of value to any community, be it in a city, a suburb, or the country, as long as there are data to work with.
1.1 This Book: The Practice of Urban Informatics
The goal of this book is to teach the practice of urban informatics. First and most obviously this comprises data science skills, including how we access data, manipulate it to expose the desired information, analyze it to answer questions, and visualize and otherwise communicate our insights to others. Those skills are the core curriculum of the book. But we want to do more than just play with data. Often, the data used to serve communities are “naturally occurring” in some way, generated as the byproduct of some system, like 311. As such, we are forced to determine how to interpret them. What do these data mean? How do we understand the information in them? These skills of interpretation are crucial for guiding our use of data science tools to generate valuable insights and impacts and help us frame the data science we will do.
Last, you may have already noticed a philosophical angle. In my opinion, data and technology give us a special opportunity to have impact, to hear and respond to local needs, and to reimagine 21st century communities. I think that this civic bent is central to the field, and it will be visible throughout the book, helping to frame the rest of the material. To be clear, this does not mean the book is meant exclusively for those looking to go into public service. There are a multitude of ways to serve communities, including through public service, non-profits, the private sector, or even (as I have chosen to do) through academic research. The skills in this book will be useful for anyone with any of those goals.
That said, before we start playing with data, the rest of this chapter describes the field of urban informatics in a bit more detail. Also, at the end of this chapter you will find more on the layout of the content of the book and how it is organized so that you can best utilize it to gain the skills that you need.
1.2 The Themes of Urban Informatics
As with any field, we might describe urban informatics in terms of three questions: (1) What inspired it?, (2) How does it work?, (3) What are its products? First, the inspiration has been the emergence of novel data that could be used in original ways. But it also includes new technologies that generate some of these data, especially those that are designed to “sense” conditions and events at precise times and places. Second, urban informatics is rather distinctive in being driven by widespread data-sharing and collaboration across institutions, including public agencies, non-profits, private corporations, and colleges and universities. We might call this the civic data ecosystem of a community. Third, the field has generated two closely related products: innovations in policy, practice, and services pertaining to communities; and a “new urban science” focused on developing a deeper understanding of those communities. This makes for five themes of urban informatics: novel data, sensing and crowdsourcing, the civic data ecosystem, policy innovations, and a new urban science. Let’s unpack each of these a bit further.
1.3 Novel Digital Data: “Big” Data or Something More?
In our digital age, computers are everywhere. And where there are computers, there are data. Every process and every transaction results in a data record. Some of the data sets are things that previously existed only on paper but are now supported by computer systems, including some of the things pictured in Figure 1.3. Think credit card purchases, utility bills (and, thus, energy and water usage), annual vehicle inspections, the marriage registry, restaurant inspections, and, of course, requests for public service through 311 systems. Others are more novel, arising from the introduction of computers themselves, especially social media. Facebook, Craigslist, Twitter, Yelp, Airbnb, newspaper comment boards, and cell-phone GPS pings all constitute “databases” of the activities of users. These lists are far from exhaustive, but they give you a sense of the diverse range of data generated by the individuals and institutions of the city. All told, they offer an unprecedented wealth of information on the behaviors, movements, social interactions, commerce and industry, and physical and environmental conditions of communities.
Figure 1.3: Many daily activities generate digital records, including commercial transactions, like credit card swipes, administrative processes, like vehicle inspections, and social media platforms, like Twitter. (Credit: touchbistro.com, fleetio.com, rss.app)
Many of the data sets I have named are included under the term “big data.” To be certain, “big data” is not a rigorous term, nor does it have a clear definition. It is really a catch all for the many new types of data that have been proliferating in recent years, a good number of which happen to be considerably larger than the kinds of data we used to have on communities. That said, the census is pretty large and has been since China’s Han Dynasty was the first to count all of its subjects (58 million, in fact) in 2 CE. Thus, it would be good for us to unpack what actually makes these novel data different apart from their size, and what those characteristics mean for the kinds of things we can do with them.
1.3.1 What Are “Big Data”?
A colloquial meme has summarized the distinctiveness of “big data” in “3 Vs”: volume, or “big”-ness; velocity, or the fact that many of these data update often, sometimes in real time; and variety, or the breadth of content. These features are often different from traditional data from surveys, observations, and experiments, which are typically more limited in size and content and are rarely updated. But are these the things that really make modern data special? Rob Kitchin and Gavin McArdle sought to answer this question by comparing the characteristics of various novel data sources (Kitchin and McArdle 2016). They concluded that volume is a by-product of two other characteristics. First, velocity, with its regular updates, contributes to an ever-expanding data resource. Second, they highlighted exhaustivity, or the intent to include all cases—that is, all posts on a social media platform, or all 911 calls, or all student records in a school district—drives size even further. They determined that variety did little to add to size.
If size were the only thing that distinguished modern digital data, however, they would not be very interesting. It is more important to understand how they enable new and different analyses and innovations. There are four things that bear noting:
(Novel) Variety: We have already noted variety as a special characteristic of modern data. Even if variety is not primarily responsible for size, it is very important to the potential of the data. Most of these data are “naturally occurring,” harvested as the by-product of some other process. This is true for 311 and other administrative data sets as well as internet-generated data. In many cases, this results in a new view on some component of behavior and society that was previously more difficult to access directly, vastly expanding the questions we can ask and answer.
Relationality: Exhaustivity requires that data be indexed, with each element having a unique serial code. Often, this indexing occurs at multiple levels. For example, a 311 record has a unique record ID but also references the address at which services were required and the street and neighborhood where that address is located. In this way, indexing creates relationality, meaning data sets that reference the same unit of analysis can be merged. Such mergers further amplify variety and the number of questions that might be asked about a given unit of analysis.
Flexibility of Records: Whereas traditional data sources usually describe the characteristics of some unit of interest, such as a person, street, or neighborhood, many modern data come in the form of records. The records of a single data set might reference a particular unit once, twice, fifty times, or not at all, creating additional detail by which one can describe all units in the population. As we will see, this is not a scripted process, and an analyst must make multiple decisions to generate the desired measure. To illustrate, the average census tract in Boston generates about 1,000 requests for service per year via 311, which might be tabulated to understand the needs of a community. But how? Should all types of requests be included? Or only those that reference a particular community need? If the latter, how many different types of needs could we quantify? These same considerations are necessary for any archive of records.
Automation: Closely related to velocity is the fact that many of these data sets are generated by automated computer systems. Events occur, information comes in, the system updates the database, and that database is immediately available. This does not necessarily affect the nature of the questions that can be asked and answered, but it does change when they can be conducted and what they can be used to build. To the former, if an important event occurs on Tuesday, we can examine it on Wednesday—possibly sooner. To the latter, if the data are automated, the insights they generate can be incorporated into other systems. For instance, a spike in 311 cases in a particular community could be caught by a computer and brought to the attention of administrators. All told, whether we use the term “big data” or not, modern digital data are distinctive and they enable a new set of analyses and innovations that previous data did not. This is owed not so much to their size, but to the combination of variety, relationality, flexibility, and automation.
1.4 “Sensing” the Pulse of Communities
In addition to the data, it is worth noting the rapid growth of technologies for sensing the conditions and events of communities. Take, for example, the Array of Things (AoT), a network of sensor nodes developed by the University of Chicago’s Urban Center for Computation and Data (see Figure 1.4). Each node contains sensors that track air pollution, temperature, light intensity, precipitation, noise levels, and physical vibrations. They even process camera footage to estimate the volume of pedestrian, bicycle, car, and truck traffic. The vision of AoT is to deploy these nodes throughout communities to be a “fitness tracker” of sorts, constantly noting conditions and supporting systems for responding to them.
Figure 1.4: The Array of Things project has installed sensor “nodes” across Chicago, IL, to capture various conditions locally to gain a composite view of temperature, humidity, sound, light, and air quality, among other things, throughout the city. (Credit: http://arrayofthings.github.io)
Sometimes, however, the “sensors” are not what we would typically expect. Thanks to smartphones, with their multitude of apps and tools, people can be sensors, too. Citizen sensing is when members of the public are a vehicle for observing and recording events and conditions. We can think of it as a form of crowdsourcing, a term that has entered common parlance through efforts like Wikipedia. In this case, instead of the “crowd” collectively contributing to knowledge, they are helping to create a real-time snapshot of the local landscape. Sometimes, participation in citizen sensing can be passive, such as when cell phone records register the location and activity of a user every time she engages with a cell tower. In other cases, the “citizens” are actively engaged in the data collection. For example, Sarah Williams of MIT worked with bus drivers in Nairobi’s informal transit system who carried GPS trackers in order to better identify their “routes”. Likewise, 311 systems enable residents to act as the “eyes and ears of city,” observing and reporting issues they encounter in their daily movements.
Sensors are rarely deployed individually. Instead, many of them work together as part of a broader network. This reflects a distinctive approach to measurement in which many narrow observations are combined to build a comprehensive, or composite, view of the world. For instance, networks like AoT are deployed far and wide (see Figure 1.4 for an illustration). Each node observes only a small slice of the world, but together they track the entirety of the city. The same is true for citizen sensing. Wherever the people go, sensors go. Something similar can be said for the administrative records we described in Section 1.3, as it is the whole corpus of records that gives us a full view of communities.
Capturing the characteristics of communities in this composite fashion is not an entirely novel concept, of course. For example, in the 1990s the Project on Human Development in Chicago Neighborhoods surveyed thousands of Chicagoans about their neighborhoods to describe the variation in physical and social conditions across the city. Sensor networks and citizen sensing efforts, however, take this concept to a whole new level, often with many, many more records distributed through space and time. In this way, we can observe the pulse of the city, or the daily rhythms and long-term trends of the places, people, and institutions that constitute an urban area, in ways that we never have before.
In Figure 1.5 we see multiple examples of how 311 reports can reveal the pulse of various aspects of maintenance in neighborhoods. Looking at the frequency of pothole requests by months, we see a sharp spike in March, which is just after the damage of snow, ice, and salt from the winter becomes fully apparent. Or if we look at requests by day of the week, we see that people are much more active on weekdays, likely through the movements associated with work and school. If we assess the proportion of snow requests by month, we see that they become the prominent concern of Bostonians during February, the month with the most snow. Importantly, we have already seen how a major event like a hurricane can disrupt the natural rhythm of society, generating events that stand out in the data.
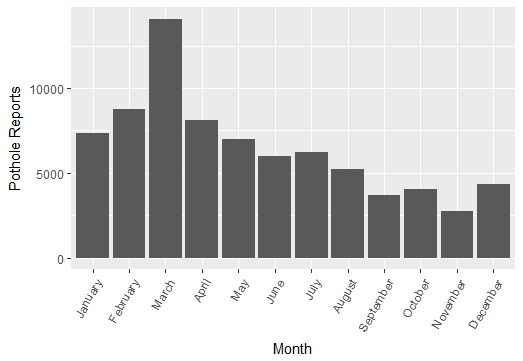
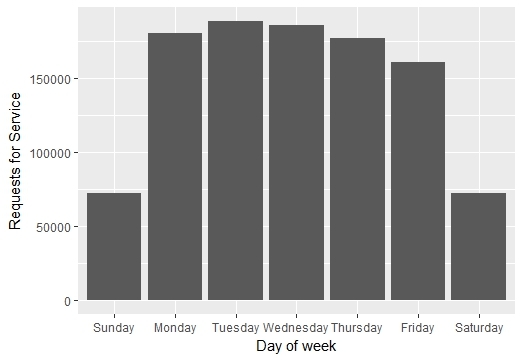
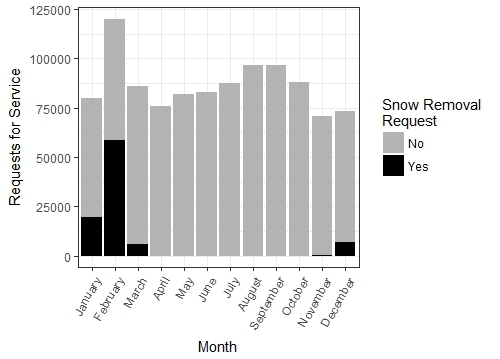
Figure 1.5: Examples of how 311 records capture the pulse of the city, including the monthly patterns of pothole requests (top left), the frequency of reports across days of the week (top right), and the proportion of snow removal requests by month (bottom). (Credit: Author)
1.5 Civic Data Ecosystem
“Open data” has become a buzz term in recent years. It typically refers to data that a government agency has made publicly available, though it can come from any organization willing to share data with few or no restrictions. The open data trend has arisen in part from a push for government transparency but also from excitement about the valuable insights and tools that might be produced if we put these data in the hands of a broader community of analysts and “hackers.” As a result, many cities have passed “open data ordinances” that require departments to publish their data in machine-readable formats (i.e., spreadsheets that can be analyzed) and built “open data portals” where the public can access these data.
Though the narrative has often been around the open data themselves, more attention should be paid to the community of individuals and institutions who stand ready to translate those data into insights and innovations. Without them, the open data would do little more than sit on hard drives and servers, not having very much impact at all. Boston, Massachusetts, the city where I live and work, serves as a good illustration of how such a community can operate.
Boston is renowned for its many colleges and universities and its thriving tech sector, including both industry behemoths, like Microsoft and Google, and hundreds of start-ups. Local city government has also been at the forefront of data- and technology-driven innovation, led by the Mayor’s Office of New Urban Mechanics, a unique initiative that acts as a research and development lab that experiments with ways to improve city services and infrastructure. There is a vibrant Code for America brigade, consisting of volunteer “hackers,” developers, and analysts. Further, non-profits and community activists have become involved as well. Advocates for housing, education, public safety, and environmental justice regularly ask how data and technology can best be used to support local residents—and question when it appears to be bypassing or even harming those same communities.
The engine underlying urban informatics in Boston and elsewhere is not just the presence of many organizations prepared to work with data. It is the way they work together, sharing data, co-designing questions and identifying challenges, and collaboratively generating solutions. The sum of these overlapping partnerships across a region is a network that is greater than the sum of its parts. This might be referred to as the civic data ecosystem.
For over a decade now, I have had the privilege of building and leading an interuniversity consortium at Northeastern and Harvard Universities called the Boston Area Research Initiative (BARI; see also Figure 1.6). BARI’s mission is to convene greater Boston’s civic data ecosystem to imagine how data and technology will reshape communities in the 21st century. The consortium focuses especially on opportunities to advance core societal values—things like equity, justice, democracy, resilience, and sustainability. One of my favorite moments every year is our annual conference, where hundreds of representatives from local public agencies, private corporations, non-profits, colleges and universities gather together to share the work they have done over the previous year and start new collaborations.

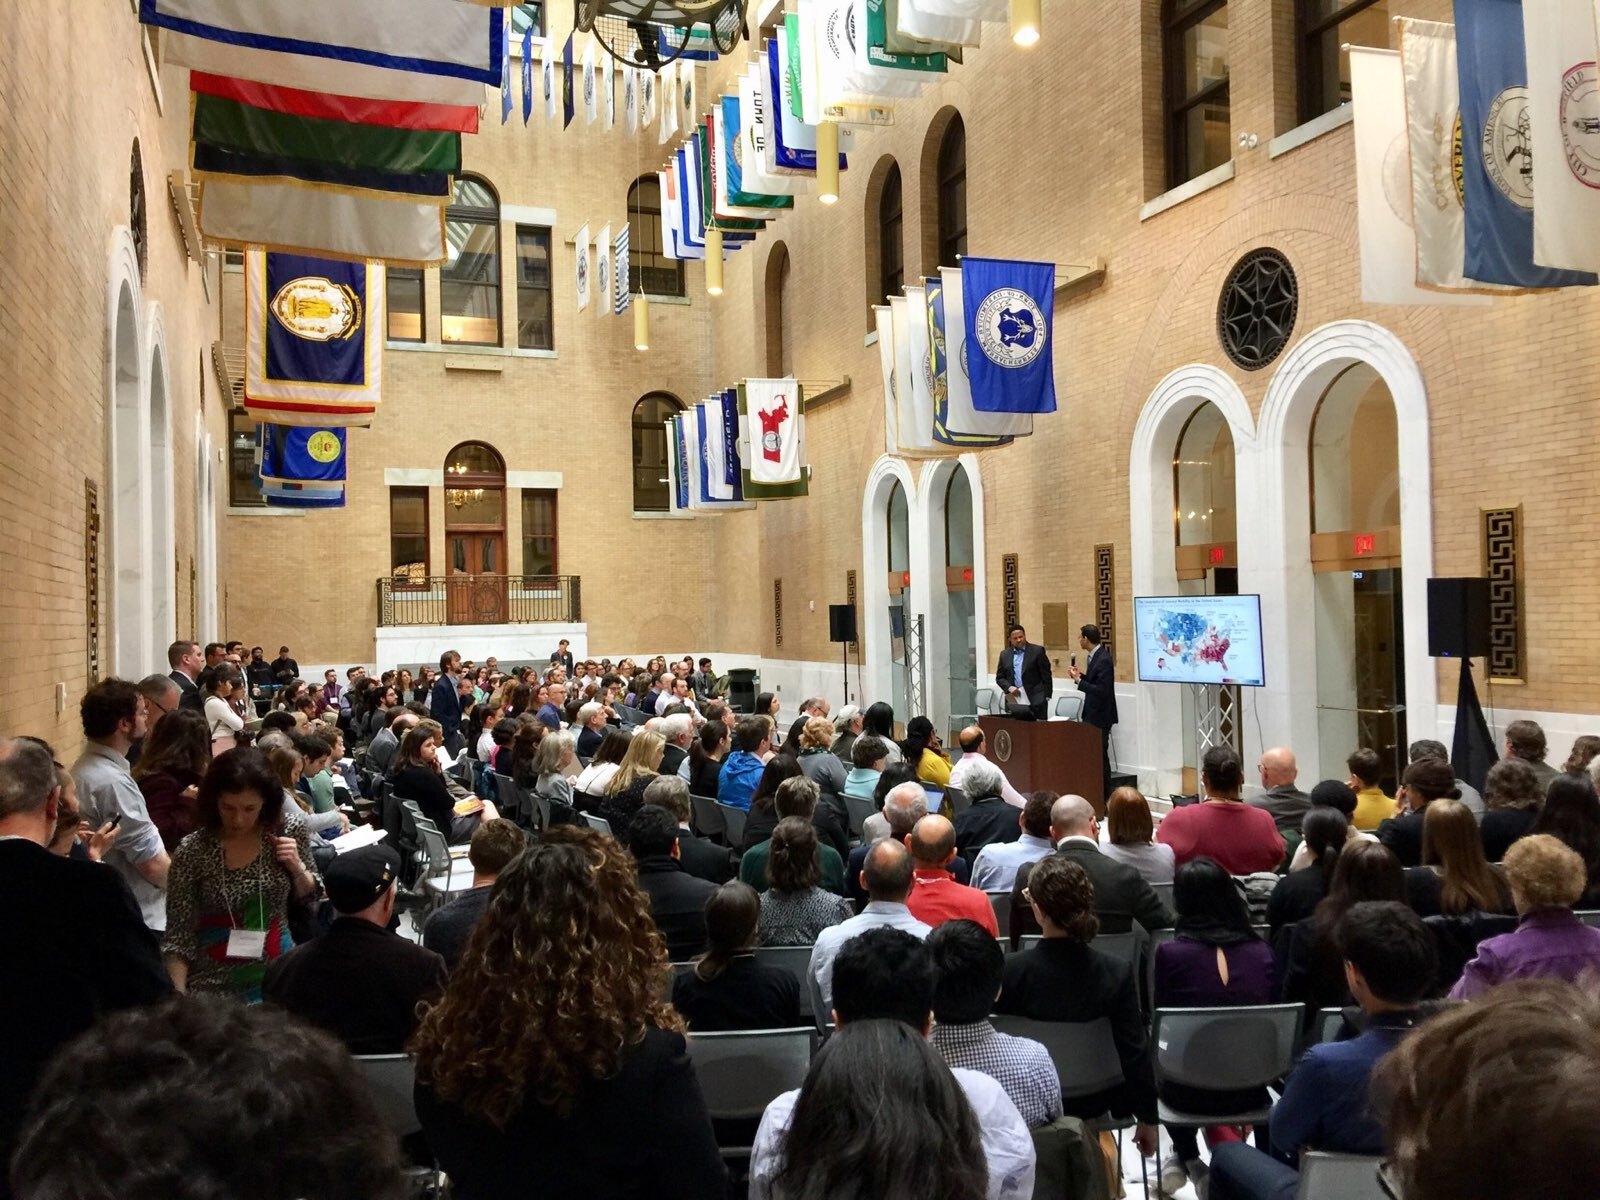
Figure 1.6: The Boston Area Research Initiative (left) is a consortium of researchers, policymakers, practitioners, and community leaders from across greater Boston committed to supporting a thriving civic data ecosystem in the region. The annual conference (right) is an opportunity for members to share data-driven research and policy efforts and develop new collaborations. (Credit: Author)
Thus, open data is only a small component of urban informatics. It is made possible by local institutions building sustained partnerships that center on the use of data and technology to advance communities. Without collaboration, everyone is simply analyzing their own data for their own isolated purposes, creating a collection of narrow insights that do not necessarily intersect. Together they can develop questions and answers that have greater impact. It is in acknowledgment of this spirit of collective effort and public-minded data science that I refer to this not only as the data ecosystem, but the civic data ecosystem of the city.
BARI is not the only center that seeks to enable and support its local civic data ecosystem. Others include the Center for Urban Science and Progress at New York University and its partnerships with New York City, Metro21 at Carnegie-Mellon University and its collaborations with Pittsburgh and Allegheny County, the 21st Century Cities Initiative at Johns Hopkins University and Baltimore, and the non-profit Envision Charlotte in North Carolina.
Of course, not every city (or county or town) is as blessed with the density of technology-oriented institutions as these examples. Nonetheless, they all generate data. They all have smart people who can identify challenges and questions facing their communities. And they all have the opportunity to build collaborative relationships that can pursue those challenges and questions. Not every one of them is going to be using artificial intelligence, installing block-by-block sensor systems, or experimenting with autonomous vehicles, but that is not the point. As the skills of analysis, visualization, and interpretation become increasingly accessible (for example, through this book!), all cities, counties, and towns can leverage data for impact. That is all urban informatics aims to be.
1.6 Policy Innovations: Changing How the City Works
There is an adage that you can know a tree by the fruits that it bears. Similarly, you can better know a field or industry by the products it generates. The most visible of these are the innovations in policy, practice, services, and infrastructure that shape daily life for community residents. These come in many different forms. My favorite illustration of this comes from the MetroLab Network, an international consortium of over 30 partnerships between local government and universities focused on research and innovation, which writes a column titled Innovation of the Month published by GovTech magazine.
By browsing the Innovation of the Month columns, one can see the breadth of impact that urban informatics has already had (see also Figure 1.7). Sensors are advancing environmental justice, as when New York City has tracked flooding street-by-street during storm surges, or when Kansas City measured air quality in COVID hotbeds. “Predictive analytics” enables interventions before crises occurs, as in a Pittsburgh-Carnegie Mellon collaboration to predict fires, or a Fairfax County-George Mason University effort to support at-risk youth. There are the ever-popular “behavioral nudges,” like a project by University of Chicago to redesign court summons to increase appearance rates. And, similar to 311’s effort to crowdsource public issues, Philadelphia and the University of Pennsylvania crowdsourced community opinions to inform decisions to restore or replace historic housing.
Each of these projects highlights something important about the word “transformation.” Transformation has the trappings of science fiction, evoking visions of the flying cars in The Jetsons, Tom Cruise solving crimes before they happen in Minority Report, and robots managing all daily operations in Isaac Asimov novels. Transformation does not occur overnight, however. It must be built through a multitude of modest, incremental advances on everyday problems—like addressing floods and air pollution, anticipating events like fires or high school dropouts, or simply getting people to show up to court. Each of these can be seen as an isolated innovation, but together they turn society into a smarter, and, hopefully, better place. In other words, transformation is the long-term product of rather mundane advances.
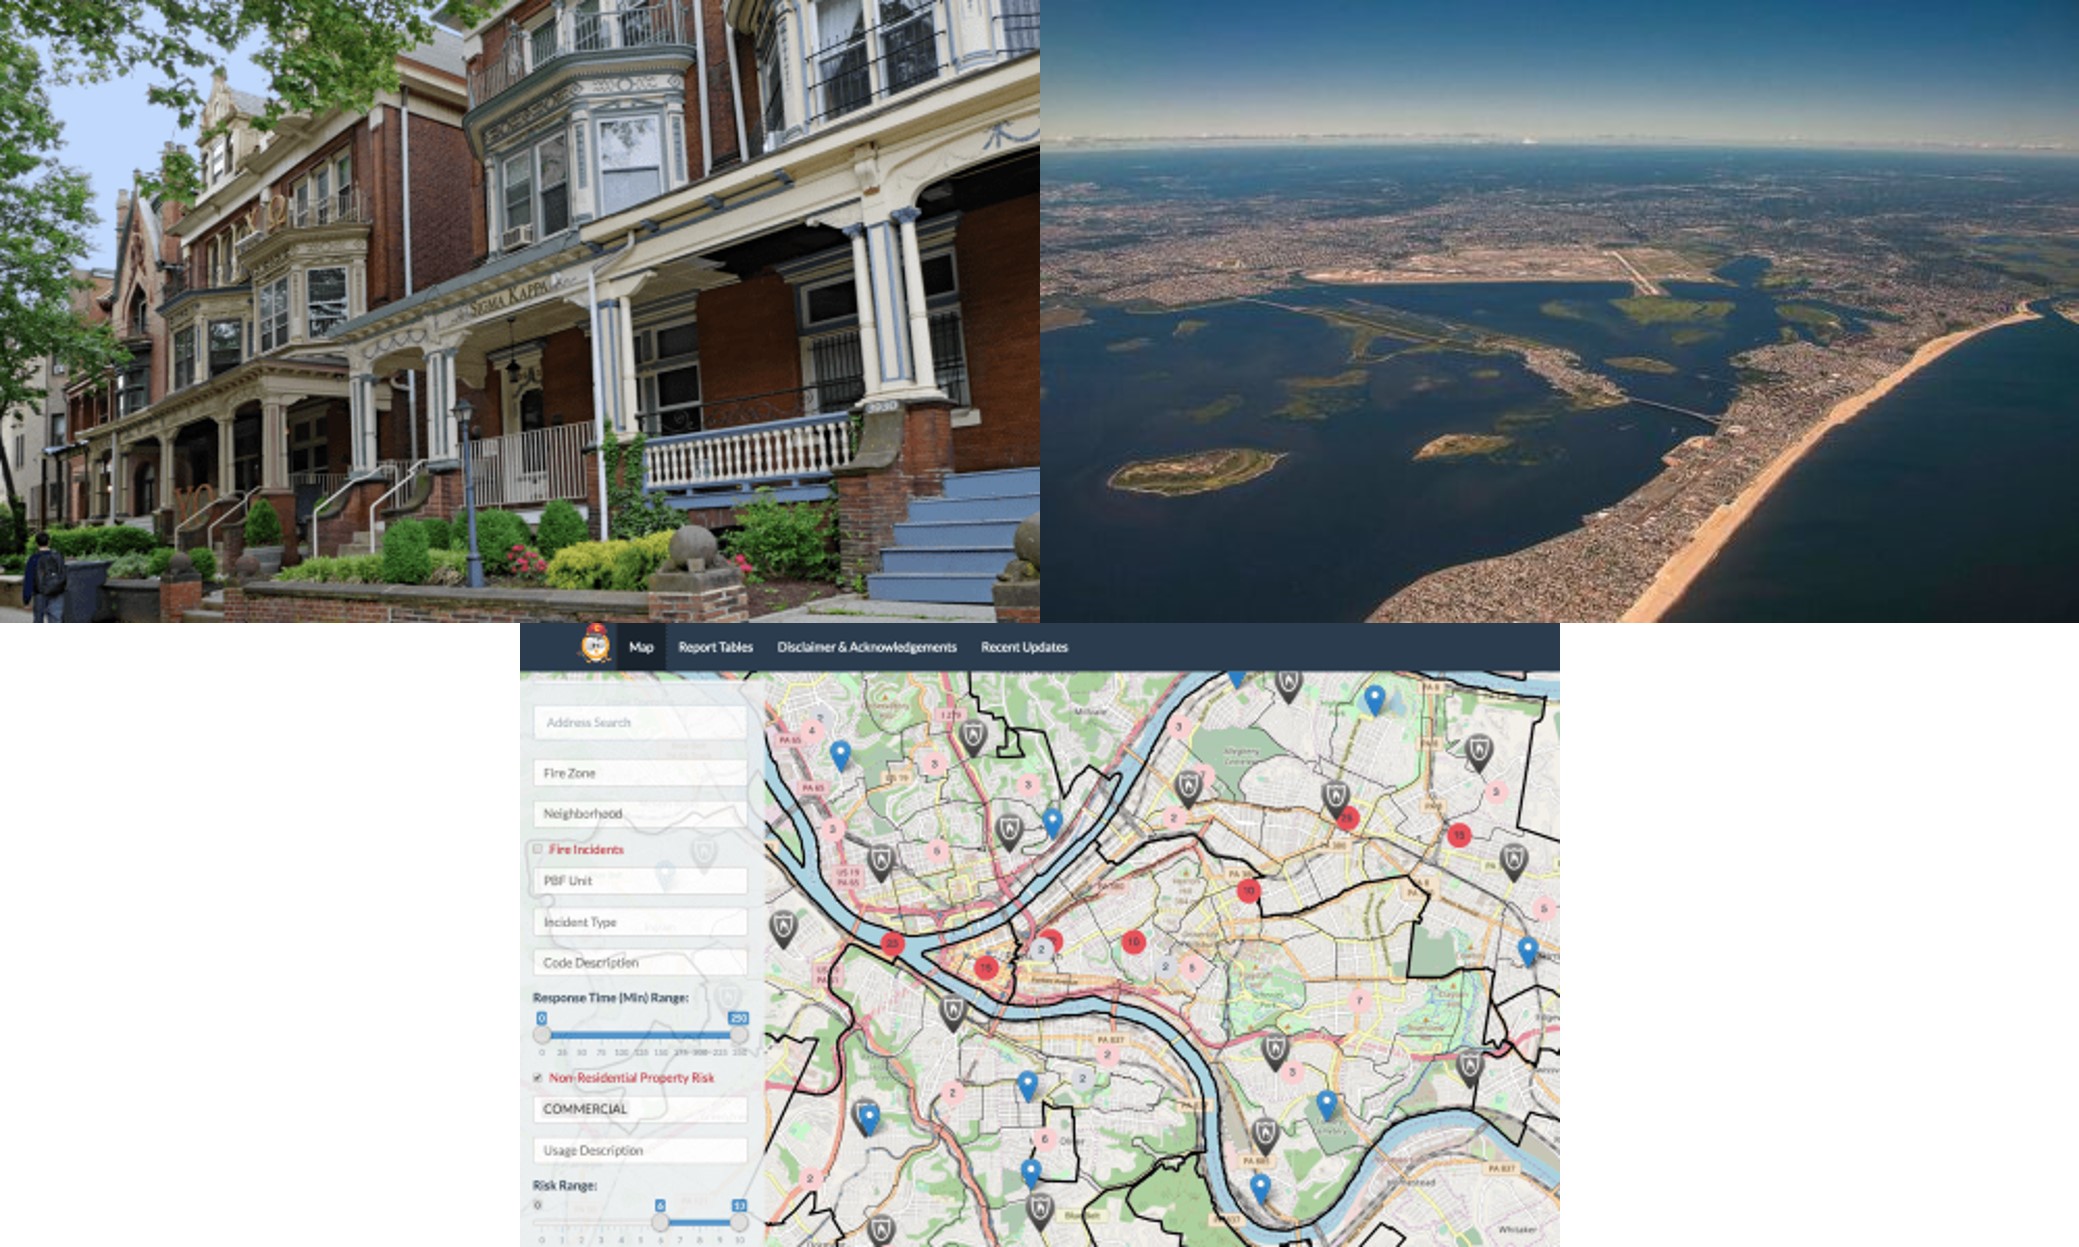
Figure 1.7: MetroLab Network’s Innovation of the Month column captures the breadth of impact that urban informatics might have, including crowdsourcing community opinions to guide decisions around historic housing in Philadelphia (top left), localized sensors to manage street-by-street flooding in New York City (top right), and a data-driven system to predict fires in Pittsburgh (bottom). (Credit: MetroLab Network)
To what end is urban informatics gradually transforming society? In his book on smart cities, Anthony Townsend argued that all of our innovations are just modern solutions to the same problems we have always faced—sanitation, transportation, infrastructure maintenance, education, public safety (Townsend 2013). This is absolutely true on a surface level, but it ignores the civic values that are often guiding the design and implementation of these solutions. This is apparent from looking closer at 311 systems.
311 systems use technology to make the maintenance of city services more efficient and effective. At their heart, though, they reflect a collaboration between government services and the residents and communities that they serve. It is a democratizing force that makes those services more accessible and responsive, while also encouraging constituents to participate directly in the governance of their own city. 311 is the epitome of coproduction, an approach to public administration that directly involves the public in the governance process. It also has been an icon for the closely related trend of civic tech, or the effort to use data and technology to enable people to collectively contribute to society, through government services or otherwise. Other examples include the Nextdoor platform, which connects neighbors to each other; participatory budgeting, in which community members have increased input into the use of public funds; and even apps like Waze, through which drivers alert others to hazards on the road.
This is all to say that urban informatics promises to transform communities. In some ways, the end point of this transformation is unknown and probably unknowable. It will be the product of many iterative advances that seek to address everyday challenges. As these advances build upon and learn from each other, however, they begin to take a distinctive form, a literal embodiment of the civic mission that inspired and guided the work. Being that “civicness” often translates into concerns for one’s neighbors and the overall well-being of society, we see many projects that also seek to advance related values, including racial and socioeconomic equity, sustainability and resilience in the face of climate change, and social and environmental justice in a rapidly changing society. These are the kinds of things that practitioners of urban informatics tend to build.
1.7 The New Urban Science: In Search of a Paradigm
In the early 20th century, the field of sociology was just taking shape, and no group of scholars was more influential than the Department of Sociology at the University of Chicago. The so-called Chicago School of Sociology was captivated by the emergence of the industrial city and the ways in which it was transforming society. They concentrated especially on how our historic reliance on close relationships among family, friends, and neighbors for most information and activities had been replaced by societal institutions, like newspapers, schools, and other public services. These insights on what they referred to as the social organization of a community gave rise to ideas that continue to frame how we think about the dynamics of neighborhoods, including aspects of crime, public health, education, economic activity, and public advocacy. We might call this the original urban science.
Cities might not be all that “new” anymore, but academic scholars continue to be drawn to them. This is especially true now as data and technology not only provide novel lenses for understanding communities but also instigate transformations that themselves merit closer study. And they attract scholars of all disciplines. It is often quipped that cities are a stage upon which all aspects of human society are played out, in which case urban science can support just about any question or topic from across the social sciences. The opportunity is greater than that, though. To stretch the metaphor, engineers want to study the stage itself and to develop guidelines for building a better one. Environmental scientists have found that the same phenomena they tend to study in nature, such as soil, air, and water conditions and weather patterns, also vary across neighborhoods in meaningful ways. Physicists and chemists are discovering that many of their theories about physical structure can be extended to the construction of cities.
An interdisciplinary urban science is the second set of products generated by urban informatics. But what does that mean? What value does it create? A lot of it is driven by the new data and methods that are now available. As we will see throughout this book, geographical information systems have unlocked the power of spatial data; network science has made sense of connectivity between individuals and communities; and rich data derived from administrative records, social media posts, and sensor systems expose the pulse of the city to study in ways that have never before been possible. Much as the policy innovations we are seeing are just the newest approaches to classic challenges, a new urban science is re-asking the same questions that were asked by the Chicago School of Sociology and their contemporaries, just with new tools and information.
Of course, it is not as simple as that. Iteratively asking new questions can lead to more comprehensive transformation. For example, network science allows us to empirically examine classic ideas regarding the social organization of a neighborhood. But there are currently no good theories for the network of communication or mobility for a city of a million people—something that can now be studied through cellphone records. Likewise, coproduction was a new idea in the 1970s that responded to and catalyzed new institutions like local crime watches and parent-teacher organizations. The scholars who originally wrote about it probably never envisioned a world in which reporting public issues and other public contributions were just a tap on a cellphone away. As such, civic tech has enabled a complete reevaluation of this area of scholarship.
Additionally, there has been an increasing awareness in academia of the power of research to have positive impact. To wit, anything that a scientist learns about a community should be of interest to those who serve that community, and anything that policymakers care about should be important enough to merit scientific study. Consistent with this ideal, all of the examples of policy innovations listed in Section 1.6 include academic partners. By bringing advanced methods, frameworks for critical thinking, and an insatiable appetite for new questions and challenges to the table, academics can partner with local leaders, both in government and otherwise, to demonstrate the mutual reinforcement between research, policy, and practice. And, in the process, they are advancing a new urban science that deepens our fundamental understanding of society.
1.8 This Book: Learning Objectives and Structure
1.8.1 Learning Objectives
I hope that to this point I have not only informed you about the field of urban informatics but also excited you to become involved yourself—or at least intrigued enough to continue reading this book. Just as transformation can be the gradual product of many mundane advances, the chapters that follow will impart the tools and skills at the foundation of urban informatics. This includes both the technical and the conceptual.
The technical skills will center on accessing, curating, manipulating, analyzing, and visualizing data, especially those that are naturally occurring. There are many software packages available for working with data, and this book focuses on one called R. This is for a few reasons. First, R is freeware, meaning that anyone with a computer can use it without requiring an expensive license. Second, thanks to a rich user community, there are add-on packages that can execute pretty much any analysis or data manipulation that exists, and certainly everything you will need for this book and beyond. R does require coding, which is a great benefit as it gives you as the analyst complete control over what you are doing. That said, do not be daunted if you have not coded before as we will work from the ground up.
On the conceptual side, data cannot speak for themselves. As an analyst, you must understand and interpret them and give them meaning for your audience. Likewise, the products of analysis and visualization are not pre-ordained. The analyst must make dozens or even hundreds of decisions along the way, all reflecting a specific use of the data. This is not to say that research is completely subjective or that people can “tell any story they want” with data. To the contrary, it requires discipline and awareness regarding the strengths and weaknesses of the data, which questions they can and cannot answer, and the purpose of the analyst. Throughout the book we will engage with these considerations as they relate to the technical skills we are developing.
1.8.2 Organization of the Book
The book is broken up into four units with learning objectives that build upon each other. Each unit contains multiple chapters that interweave technical skills with the corresponding conceptual ones, generally centered on an illustrative real-world example. The first unit, Information, concentrates on the skills needed to access, interpret, and represent the basic content of data. The second unit, Measurement, walks through the steps needed to use records to describe meaningful units of analysis—individuals, streets, neighborhoods, etc. Again, the tools of interpretation and decision-making are crucial in determining whether the measurements we create are precisely what we want and that they mean what we think they mean. The third unit, Discovery, introduces statistical analysis and more formal ways of representing relationships between variables. Here as well, the analyst must think critically about how to design models and communicate results based on the meaning of the data and the measures derived from them. The fourth and final unit, The Other Tools, contains supplementary chapters on the applications of other techniques and technologies that have become popular in urban informatics, including network science, machine learning, block chain, and 5G.
Every chapter concludes with a series of exercises for practicing the skills that you have learned. These are designed to engage both technical and conceptual skills. The exercises come in two different forms. Depending how you (or the instructor of the course you are taking) want to use this book, you may concentrate on either or both. Each is equally effective at developing the desired skills. (1) Problem Sets consist of traditional prompts that have “correct” answers. This approach will be especially useful to students who do not have access to data sets of their own. (2) Exploratory Assignments consist of a single, multipart prompt that requires the student to flexibly apply multiple technical and conceptual skills to a data set of their choosing. This approach to learning the content is particularly useful for students who have access to data, either through the course they are taking, their work, or otherwise, as they are designed to build on each other to carry students through the process of finding, making sense of, manipulating, and analyzing a single data set. Also, the exploratory assignment in Chapter 2 invites students to find an open data portal and download a data set they find interesting, so any student who wants to can pursue this option.
Each unit also contains two additional assignments. Community Experience Assignments encourage students to interact with the communities represented in their data, either in-person or through online content, in order to better examine the assumptions they have made when analyzing and interpreting. These assignments can be useful for introducing a community-engaged or service-learning spirit to a course using this text. Unit Final Assignments give students an opportunity to synthesize the skills of the unit in a single deliverable that represents information, measurement, or discovery derived from their data set. Each of these assignment types works best with the Exploratory Assignments but can also be applied to any of the data sets used in the chapters.
1.8.3 Worked Examples in this Book
Each chapter in this book presents a set of technical and conceptual skills through a worked example. These examples will always come from real-world data describing Boston, in the northeast corner of the United States. This consistency holds a number of benefits. It is always more relatable to learn skills through data sets that have real-world meaning and implication, rather than the simplistic, “canned” data sets that methods textbooks often utilize. Further, unlike those canned data sets, the real-world data force us to tangle with messiness, which is itself an important skill for the practice of urban informatics. Additionally, as noted, I have spent many years studying Boston and supporting others to do the same through my involvement with the Boston Area Research Initiative. These activities have generated a wide range of data sets that can be leveraged to illustrate all nature of methodological tool. Last, this approach gives you, the reader, an opportunity to see how an in-depth engagement with multiple data sets can illuminate the places, processes, and dynamics of a single city. My hope is that many of you will use the skills and exercises in this book to do the same for a community that is important to you.
Of course, there are also downsides to this approach, the greatest one being for those readers who do not identify with Boston, or any similar city. For example, if you are from the global South, your communities may have very different structures and relationships. I encourage you to consider how these insights translate and how they do not. You are also welcome to follow along with the steps of the worked example with whatever data set you like, as long as you are confident that you are able to evaluate whether your results look like they “should.”
1.9 Exercises
1.9.1 Problem Set
- Define the following terms and explain their relevance to urban informatics:
- Crowdsourcing
- Civic data ecosystem
- Coproduction
- Civic tech
- What are the features of “big” data that most affect the ways that they can impact research and innovation? How do these differ from the characteristics of “big” data highlighted in popular discourse?
- Are “big” data and naturally occurring data the same thing? How or how not?
- List the five themes of urban informatics. Which of the five do you think is the most distinctive or important? You are free to select more than one.
- Browse the winners of MetroLab Network’s Innovation of the Month. For each theme of urban informatics, identify at least one example that you think embodies that theme. Justify your selections.
1.9.2 Exploratory Data Assignment
Select a city, maybe your own or one nearby—or one on the other side of the world that you find interesting. Use internet resources to learn more about the civic data ecosystem there and write a 1-2 page memo answering the following questions:
- Who are the main institutions and actors? What do they each appear to contribute?
- How do you see the five themes of urban informatics at work there?
- Do one or two of the five themes of urban informatics stand out as being more central to this civic data ecosystem than some of the other themes?