13 Advanced Analytic Techniques
Assuming you have moved through this book in a linear fashion, you have learned a lot about how to access, manipulate, analyze, visualize, and interpret data, especially of the large, messy, under-documented sort that are naturally occurring through administrative processes, internet platforms, and otherwise. But as often happens with learning, you have probably realized that there is so much more to learn, and that you now have the foundational skills to pursue that additional knowledge in an informed, strategic way that will allow you to build yourself as a practitioner of urban informatics. Obviously, a single book cannot impart every skill one might need, and this is intended as an introductory text. But I want to conclude with an initial roadmap for some directions that you might go next.
This last unit of the book, The Other Tools, consists of a series of primers on some of the most buzzworthy and influential trends in the field of urban informatics and the popular push for “smart cities.” Artificial intelligence. Predictive analytics. Sensor networks. 5G. You have probably heard of all of them, but you may not fully understand what they are, how they work, their strengths and weaknesses, and their applications. Presenting that information is the goal of this unit, which is divided into two chapters: Chapter 13 presents analytic techniques; Chapter 14 presents emergent technologies. In some ways this distinction is a bit arbitrary, as data and their analysis are often central to the function of novel technologies. Here we make the distinction by including in Chapter 13 things that could be fully contained within R and other software packages and keeping for Chapter 14 technologies that require engagement with additional external hardware. Though these chapters will not make you a practitioner of these tools quite yet, they provide the initial insights that will enable you to reason about them and their uses in informed ways and to easily learn more if you so choose.
13.1 Structure and Learning Objectives
The chapters in this unit will break away from the structure of those in the previous three units. Instead of working through a specific example to learn a set of related technical and interpretive skills, each of these chapters will walk through multiple tools that are shaping the practice of urban informatics and the popular pursuit of “smart cities.” Nonetheless, in the spirit of those previous chapters, the description of each tool will be replete with real-world examples and illustrations. This chapter will focus on three advanced analytic tools that have opened up new opportunities for data analysis and its application:
- Network science, or the analysis of the ways in which people, places, and things are linked to each other;
- Machine learning and artificial intelligence, or techniques that allow the computer to determine the analytic model and its extensions;
- Predictive analytics, or the use of analytic models to forecast future events and conditions.
The chapter will offer a conceptual overview on each of these three analytic techniques that will be broken up into six parts: (1) What it is; (2) How it works; (3) When to use it; (4) Ethical considerations; (5) Major applications; and (6) Additional reading. These sections will not present the technical skills needed to practice each of these skills—each would require an entire textbook of its own! They will, however, provide enough base knowledge for you to discuss them, consider how they are relevant to your own community or work, and even to find additional resources by which you could learn how to use them yourself.
13.2 Network Science
13.2.1 What It Is
It is almost trite at this point to say that we “live in the social network.” Social media has made this readily apparent as we “friend” each other, “like” and comment on each other’s posts, and watch information disseminate across millions of people in mere moments. But we have always lived in the social network. Our friends, family, and acquaintances, and the institutions that coordinate services, like schools and local government, constitute the relationships that undergird society. There are also critical infrastructural networks, like the power grid or the interstate highway system. The analysis of these networks is distinct from any analytic technique we have learned so far in this book because we are no longer studying the people, places, and things themselves—we are studying the linkages between them. This requires a whole new data structure and set of analytic tools for examining it. The practice of these tools is called network science.
13.2.2 How It Works
Network science is the analytical study of the connections between a set of elements. These elements are often referred to as nodes. The connections between them are referred to as links. Network science was originally developed to study the interactions of children in classrooms. In these early studies, the nodes were the children and the links were whether they were friends with each other. If two students were deemed friends, either through a survey or observational protocol, there was a link between them in the network. If not, there was no link. Since then, network science has been applied to all sorts of topics, from the management of transportation systems to behavior on Facebook to the physical interactions of microscopic particles.
Network science requires a different data structure than those we have worked with in this book. Our analyses have utilized a traditional structure wherein a series of cases each have values on one or more variables. Cases are rows and variables are columns. Network science, however, is focused not so much on the attributes of the individual cases but on the linkages between them. This requires a matrix in which each cell is the relationship between two nodes. This is often represented as

where aij describes the link (or lack thereof) between nodes i and j.
Note that A is a square matrix wherein all of the nodes are represented in both the rows and columns. In the simplest cases, all aij are equal to either 1 or 0 and aij and aji are equal to each other—either there is a linkage between the two nodes or there is not. For instance, saying that child i is friends with child j is the same as saying that child j is friends with child i, and each statement indicates the same linkage (i.e., aij = aji = 1). This same basic logic might be applied to a variety of topics: Are stops in a public transit system adjacent to each other?; Which individuals in a sample of Twitter users have responded to each other’s tweets?; Which members of a city council have co-sponsored bills together? The list goes on.
There are more complex cases, however. First, it is possible to have a linkage that is measured on a gradient. Second, it is possible that the linkage is directional or asymmetric meaning the linkage from i to j can be different from the one from j to i. To illustrate, let us take the popular example of using cellphone mobility data to analyze flows between neighborhoods. In this case, aij would be set equal to the proportion of residents of neighborhood i that visited neighborhood j. Thus, aij and aji would take on distinct values based on the movements of the residents of each neighborhood. You can compare the representation of this measurement strategy with the simpler one seen in the previous paragraph in Figure 13.1.
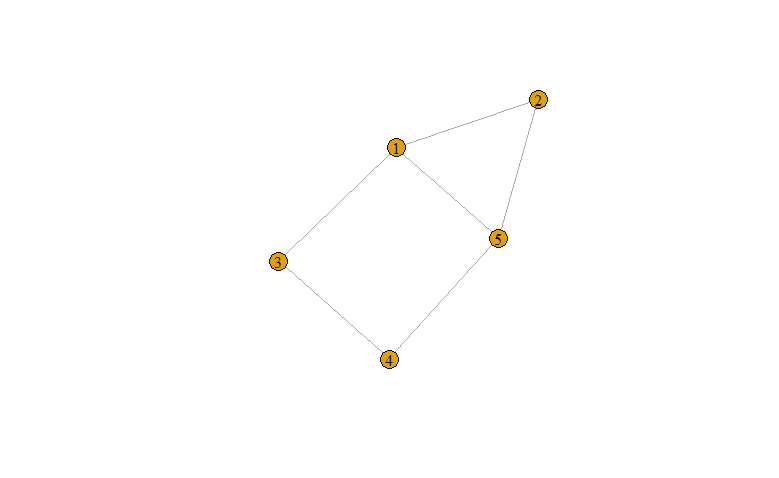
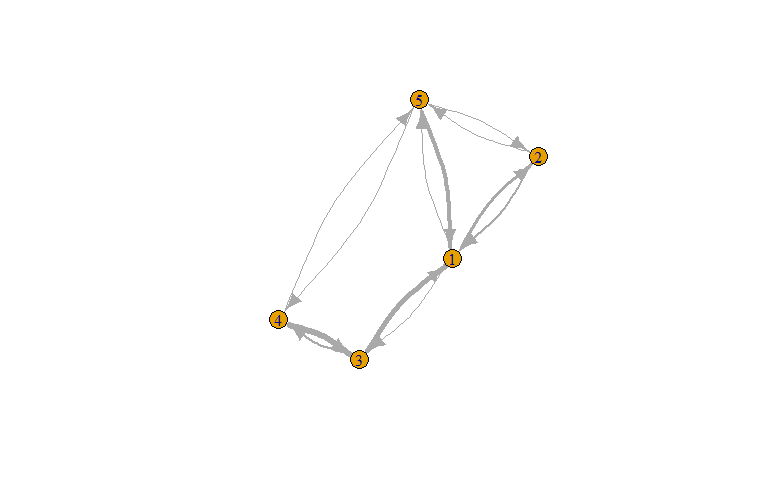
Figure 13.1: Networks can have varying levels of complexity, as illustrated by these two dummy networks of 5 Facebook users. In the simplest form, we can represent relationships as 0/1 and being shared by two nodes, for instance, whether two users are friends (top). This is a symmetrical (or undirected) and unweighted network because the relationship goes both ways and either exists or does not. A more sophisticated representation might be the number of times each user has liked a post made by the other user (bottom). This is an asymmetrical (or directed), weighted network because the linkage can be different depending on which user the activity is going “to” or “from” and it can take a variety of values.
The matrix structure of a network data set complicates the process of analysis. No longer do we have rows and columns. In fact, our matrix only contains one variable. That is, it contains the values for a specific type of linkage. What if we have multiple types of linkage we want to understand? For instance, a lot of work in recent years has used cellphone-generated mobility records to examine racial segregation. Understanding this phenomenon fully would require not only a matrix of movement between each pair of neighborhoods i and j, but also the physical distance between each pair of neighborhoods, whether they are connected by public transit, and so on. Each of these would be their own matrix.
13.2.3 When to Use It
When we analyze networks, we are generally trying to analyze one of three things.
- Characteristics of the linkages themselves. This can include trying to explain why some linkages are present and others are absent, or, for linkages that have a gradient, why some are stronger and others are weaker. For instance, to what extent does the distance between neighborhoods explain the tendency of people to move between them? How does race or income explain these movements? When we have longitudinal data, we can study how these linkages emerge or strengthen and how they dissolve or weaken.
- Attributes of nodes IN LIGHT OF the structure of the network. This might include how outcomes and impacts can travel along interconnections. For instance, recent work on segregation has found that mobility between high-poverty neighborhoods can reinforce local vulnerability to crime. A related area of inquiry is to discover how the attributes of elements cluster or become clustered within the network, or how characteristics spread throughout the network. For example, mobility data was used intensively during the onset of the COVID-19 pandemic to track how infections moved between communities. Note that I have written “in light of” the structure of the network in caps. This is because thinking in terms of a network can be tricky. It is easy to slip back into traditional hypotheses that use attributes of a node to predict an outcome. The key is to make certain that the independent variables describe the node’s placement in the network, for instance, the number or strength of linkages it has, the nodes to which it is linked, whether it is in the center of periphery of the network, or otherwise.
- Structure of the network. To network scientists, the network itself is an important subject of study. For instance, the interconnections in a racially segregated city will look very different from those in a more integrated city. Examining the structure as a whole can tell us much about the underlying dynamics of the system. Further, it can provide insights on emergent properties—that is, systemwide outcomes. For instance, does segregation tell us something about how a city would evacuate when faced with a major storm?
As you can see, the opportunities for analyzing network data are many. Luckily, statisticians have developed a variety of software packages, including multiple for R (including one named network; see Section 13.2.6), that can analyze networks in a multitude of ways. These include tools that are analogous to the statistical tests we have learned in this book (e.g., regressions that use one type of linkage to predict another) and a large variety that are more specific to the special opportunities created by networks.
13.2.4 Ethical Considerations
The ethical considerations associated with network science are less about its use as a methodology and more about the types of data sets that tend to be popular in network science, such as social media posts and cellphone generated mobility data. Many of these data raise questions around privacy. There have also been concerns about how Facebook and other social media companies capitalize on these data to design and promote services that prioritize profit over the well-being of their users. To do so, they mine our personal relationships to generate insights, but they then implement these insights in ways that further manipulate the operation of the social network. These are not critiques of network science itself, of course, but of the data sources and use cases to which it can be applied, which have become increasingly intimate and powerful.
13.2.5 Major Applications
As you have probably grasped at this point, network science can be applied to many, many different topics relevant to cities and communities. At the risk of potentially leaving out some opportunities, I will provide a short list of four areas of inquiry that I see as the most promising at this time. Some of these are illustrated in Figure 13.2.
- Within-community social dynamics. As we saw in Chapter 10, scholars have long been interested in how the relationships between neighbors emerge and operate, also known as the social organization. Network science enables new directions on this subject. For instance, a recent series of studies have identified “ecological networks,” demonstrating how the tendency of residents to visit the same institutions (e.g., schools, stores) can lead to more relationships between them, indicating the important role that interactions at these institutions play (Browning et al. 2017).
- Between-neighborhood flows. As we have already discussed, scholars have been studying how individuals move between neighborhoods. This has been used to better understand the origins and consequences of segregation (Wang et al. 2018), the transmission of infection across communities (Badr et al. 2020), economic development (Eagle, Macy, and Claxton 2010), and other critical aspects of community well-being.
- Institutions as conduits for causal dynamics. Institutions create networks in a variety of ways. Transportation systems connect neighborhoods. Many cities have school assignment systems creating geographic and demographic mixtures at schools, thereby linking communities to each other. Are there outcomes that “travel” along these linkages? For instance, do low-income students who attend mixed-neighborhood schools have more access to opportunity and learning? A common refrain against public transit is that crime will be more likely to migrate from high- to low-crime communities. Network science can probe whether this is actually true.
- Emergence of community-level properties. Is a community “resilient” during a disaster? If so, or if not, why? Is it a product of the local social network? How well is the community connected to institutions? These and related questions that use the characteristics of a local network to predict major outcomes for the community as a whole are crucial and rooted in network science.
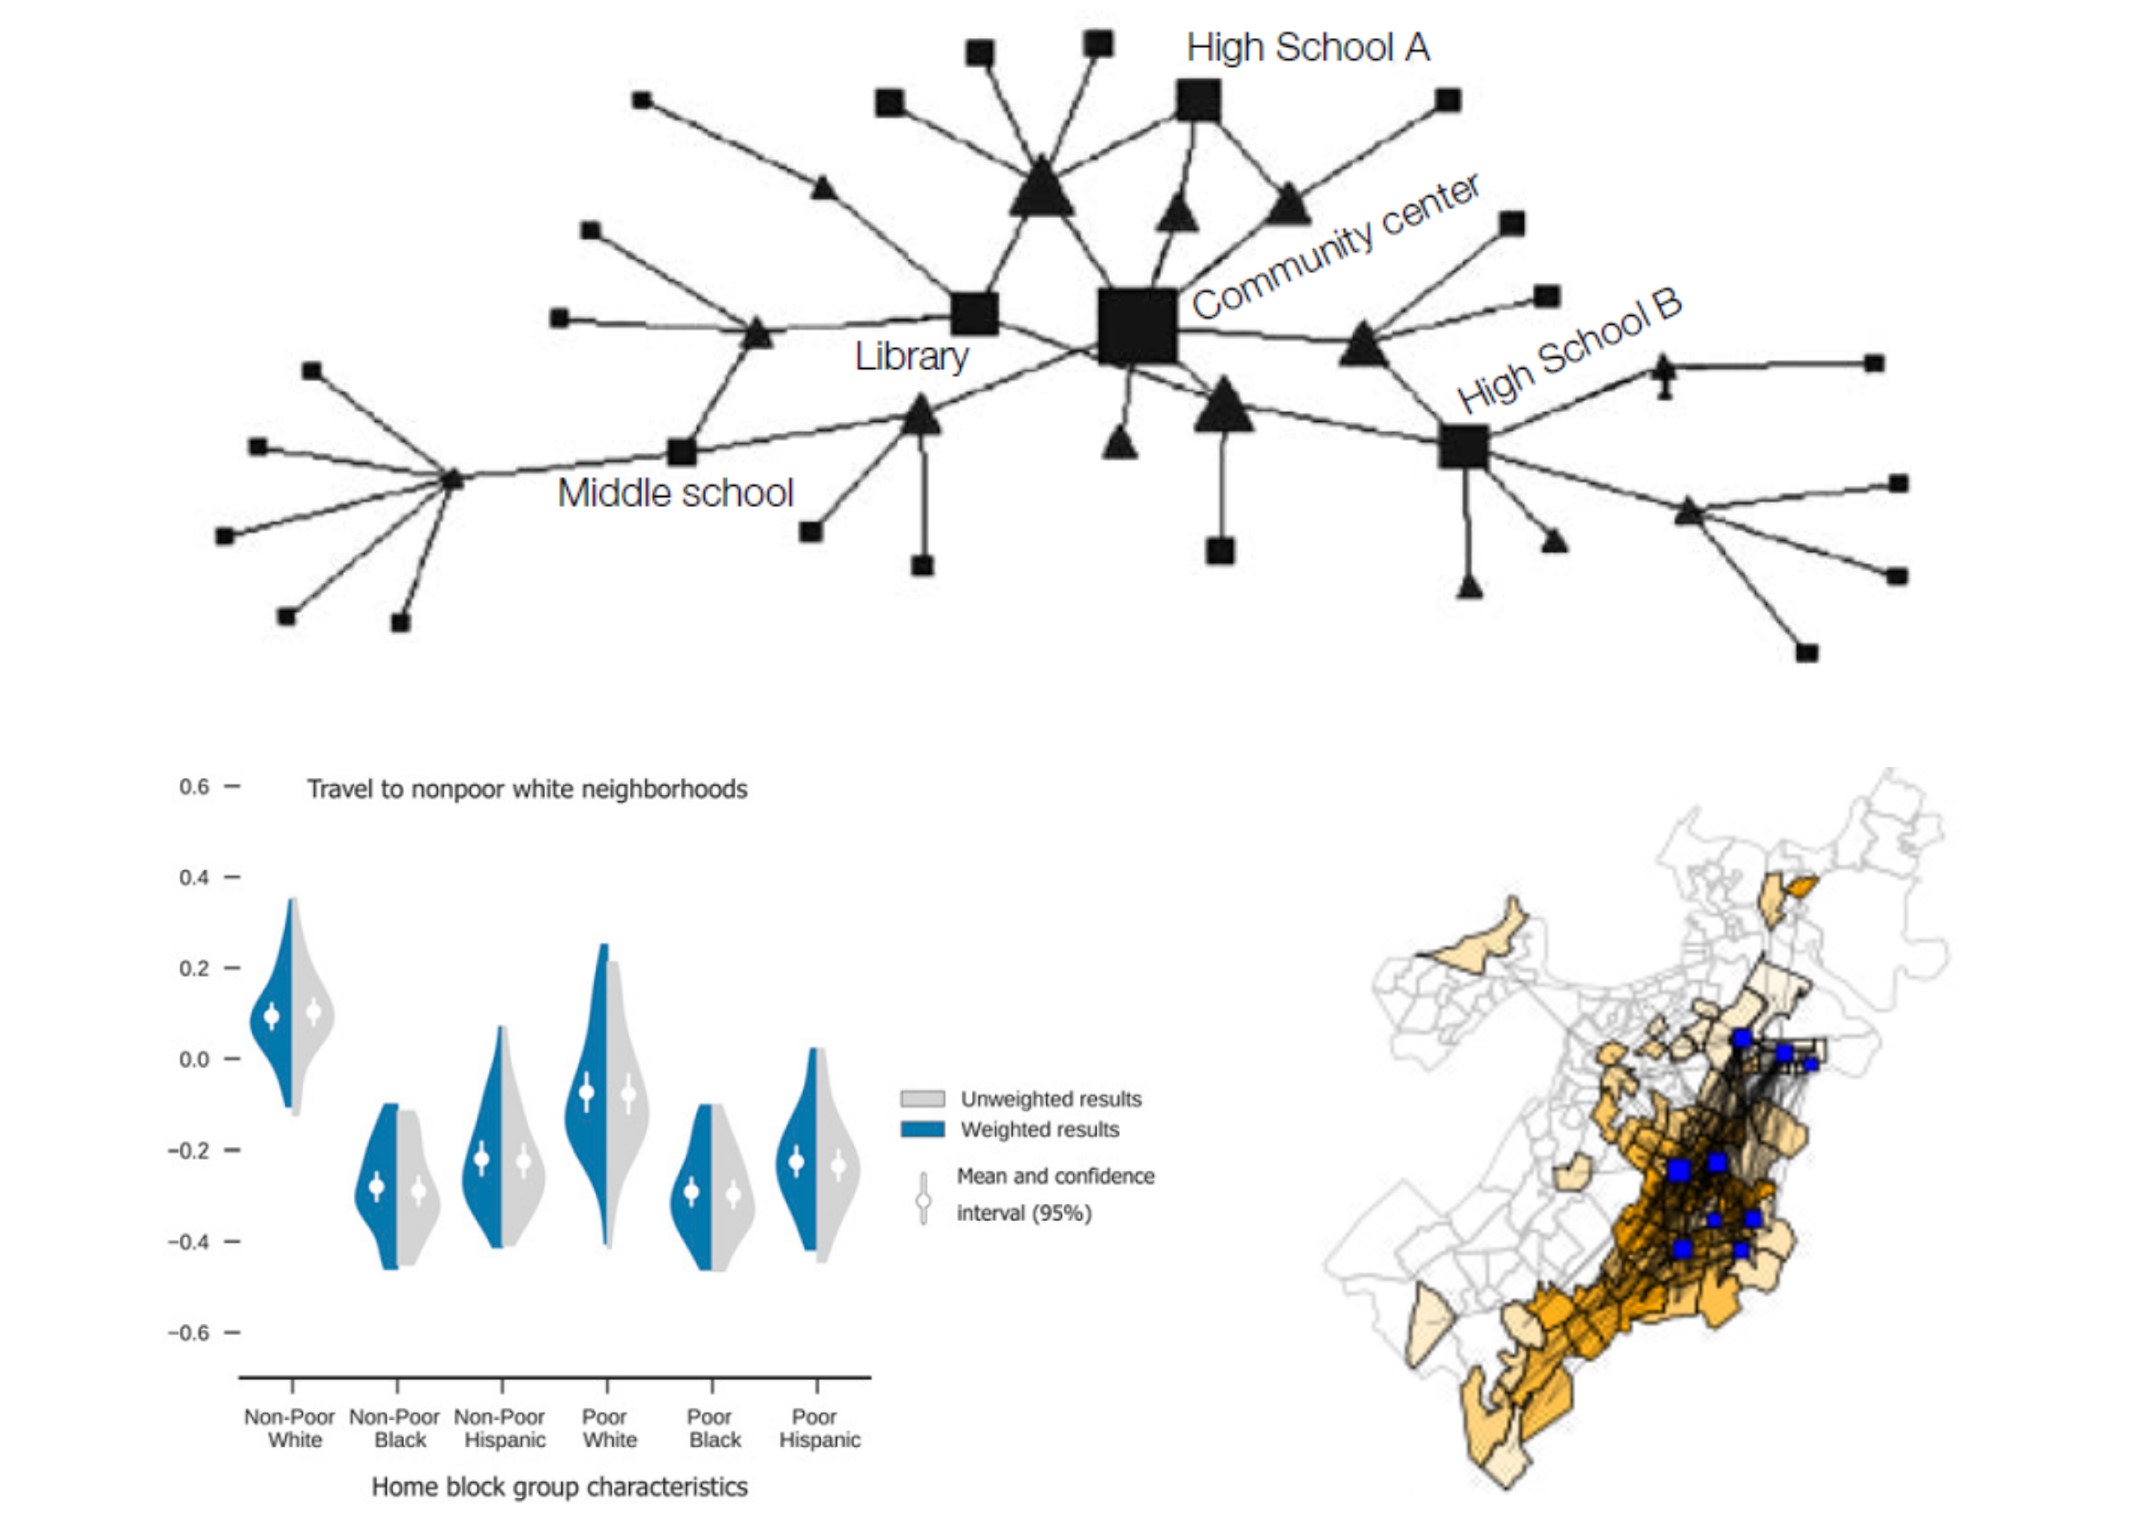
Figure 13.2: Network science can be applied to many different questions. We can analyze the social organization in communities (top) through the tendency of residents (triangles) to visit the same places (squares). We can study segregation between communities with different racial and socioeconomic characteristics, including how often they visit each other (bottom left). We can study how much the neighborhoods of a city are connected to each other through attendance at different public schools (bottom left). (Credit: Browning et al., 2017; Wang et al., 2018; BARI)
Each of these four areas of inquiry capitalizes on the unique advantages of network science. As you can probably see, they are not only interesting questions analytically, they also promise insights that are actionable, potentially informing new or refined policies, programs, and services for communities. As always, these advances could come from the public, private, or non-profit sectors.
13.2.6 Additional Reading
The New Science of Cities by Michael Batty presents a network approach to studying cities (2013, The MIT Press).
Big Data of Complex Networks by Matthias Dehmer, Frank Emmert-Streib, Stefan Pickl, and Andreas Holzinger presents the ways that big data might be leveraged to study complex networks (2020, Chapman Hall / CRC Press).
network package in R, by Carter T. Butts, includes many functions for constructing and analyzing data structures for network science.
13.3 Machine Learning and Artificial Intelligence
13.3.1 What It Is
A lot has been made of machine learning in popular discourse. Even more is made of the ways that artificial intelligence (AI) is going to transform society. Alexa and Siri hear our voices, interpret our words, and serve up the desired information. Autonomous vehicles will change transportation as we know it by navigating streets and communicating with each other via WiFi. Investment strategies are now based on “bots” that predict good bets. In fact, many of those bots were designed by other bots. In response to this hype, some circles mock the vagary of machine learning and AI, as in the cartoon in Figure 13.3, which pokes fun at the idea that these tools are just fancy window dressing for traditional statistics. Who is right?
We can square the futuristic and critical perspectives on machine learning and AI by understanding two things. First, these techniques are based on traditional statistical tools. Second, they advance the power of these statistical tools by allowing the vast computational power of modern technology to determine and test the models. These two facts, respectively, explain both the hesitance and excitement. The computers can build models that are far more sophisticated than what a human would develop, a sophistication that can then build on itself to generate fundamentally distinct insights and products. But the statistical tests are still subject to the same weaknesses that we have seen throughout the book, including bias and overinterpretation, and the power of machine learning and AI will only amplify these issues and can accidentally encode them into the new technologies that have been hailed as so transformative.
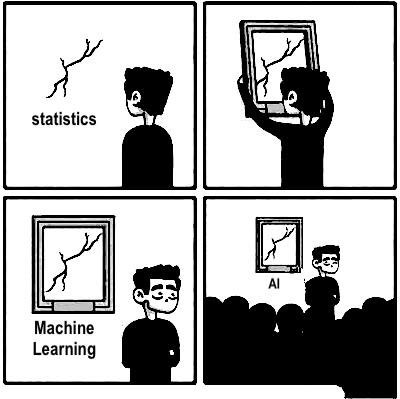
Figure 13.3: A meme that pokes fun at the way machine learning and artificial intelligence use traditional statistics, highlighting how the issues with statistics are still present, they are just being covered up by fancy framing. As with most cartoons, this one simplifies the situation, but the lesson is instructive. (Credit: https://www.instagram.com/sandserifcomics/).
13.3.2 How It Works
Machine learning and AI both begin by asking a computer to make sense of a large data set. This process is called training and often involves a surprisingly limited amount of human intervention. Of course, there are dozens if not hundreds of different machine learning techniques, each with its own assumptions and underlying mathematics guiding the process by which the computer learns the contours of the data set. Some of the more well-known examples include random forests, which represent the organization of data as a series of decisions to place data in either of two categories; and neural networks, which try to mimic the structure of the human brain. For our purposes, training requires an analyst to specify: (1) the outcome or dependent variable that the analyst wants the computer to be able to recognize; (2) a large set of cases, each described by a large number of variables, or features as they are called in machine learning terminology; and (3) a technique (e.g., random forest) by which the computer will learn how features and their combinations predict the desired outcome.
The second step of machine learning is testing. At this stage, the researcher provides the computer with an additional data set. Most often, they split the data set into separate training and testing data sets before the analysis. Whereas during the training process the computer uses information on the outcome variable to identify the best-fitting model, during testing the computer uses that model to predict the outcome for each case. These predictions are compared to the actual data and the accuracy of these predictions is used to assess the power of the model. The more accurate the model is when making these predictions, the better.
We might illustrate machine learning with the example of facial recognition, which has been a subject of much attention in recent years. The first step of developing a model for facial recognition is to provide a computer with a vast number of pictures, some of faces, some of other things (e.g., cats, chairs, musical instruments, construction tools, etc.). In the training process, the computer develops a model of the features in a picture that help it determine whether something is a human face or not. We would then test the power of this model against a new set of pictures. Obviously, facial recognition has gone far beyond this initial step. Subsequent advances have involved machine learning of facial expressions, identification of individuals (like Face ID on iPhones), and so on. Accomplishing these additional levels of sophistication has been through the same basic process of testing and training.
It is important to distinguish between machine learning, traditional statistics, and AI. In traditional statistics, the analyst pre-specifies the model—that is, the independent variables whose relationships with the dependent variable are being tested. In machine learning, the computer builds this model itself. In some cases, the final model may look a lot like the types of regressions we learned about in Chapter 12, it just happens to have been built by the computer based on the strongest relationships in the data set rather than the insights of the analyst. More often, it entails a variety of complex combinations (or interactions) between variables that analysts would rarely attempt to specify themselves. Thus, machine learning makes the fundamental tools of statistical modeling available to the vast computational capacity of computers.
AI is when machine learning processes are incorporated into a larger decision-making system. That is, the model developed through machine learning on past information is instigating actions based on new events and information. Typically, AI places machine learning in a feedback loop that uses new experiences to refine the model. That is, each time the system is asked to make a decision, it saves the data around the event and its outcomes, adding it to an ever-growing “training” data set. In this way it is able to continue evaluating and adjusting its own model for future events.
13.3.3 When to Use It
Machine learning is very powerful, but it has some limitations. First, it requires lots of data. The definition of “lots” varies as more sophisticated approaches often require more data, but in most situations an analyst will want thousands of cases to conduct a training and testing process. Also, for it to be a meaningful improvement over traditional statistics, machine learning needs lots of features (i.e., variables) that may share complex relationships with each other and the outcome of interest. Machine learning is then able to make sense of this complexity in service of building a model for predicting a desired outcome. For instance, pictures have many, many ways their pixels can be organized, including shapes, color contrasts, etc. As such, defining the rules for “what is a face?” manually would be painstaking if not impossible. And yet, with enough well-designed data sets and training processes, a computer can build this rule set itself and distinguish a face from other objects with near 100% efficacy.
A second limitation that an analyst must always keep in mind stems from the complexity that machine learning can achieve. Often, it entails combinations of variables that are difficult to meaningfully communicate. And many machine learning techniques do not report what these combinations are. For this reason, machine learning can predict things, like if something is a face or not, but it might not be able to tell us why something is a face. We have to derive this information post-hoc, but sometimes even this is tricky. Consequently, machine learning is not always the idea tool for advancing our own understanding of a phenomenon, which, as discussed in Chapter 6, complicates its potential as the basis for designing new, more effective strategies for action. It also creates some anxiety regarding a lack of transparency, especially when developed into AI, as we will explore further in Section 13.3.4.
13.3.4 Ethical Considerations
There has been a lot of anxiety about machine learning and AI, and for good reason. I want to group these concerns under two main umbrellas. The first might be summarized as the “garbage in, garbage out” critique. A colleague and leading scholar in machine learning once said to me, “When I conduct an analysis, I don’t care if your data are right or wrong. I only care that they can predict something.” This is how statistical tests work in general, but it highlights a deep vulnerability to machine learning. The development of science and science-based practice has depended on colleagues looking at each other’s data sets and models and pointing out weaknesses in interpretation and assumptions. But what if we are allowing the computers to build the models themselves? Who is policing the misinterpretations of the computer?
Suppose, for instance, that we give a computer thousands of images of faces and other objects in order to develop an algorithm for facial recognition but all of the faces are from White people. The computer will then build a model for facial recognition with faces defined as White faces. By providing the computer with a biased training data set, we produce a biased model. This actually happened in the early stages of facial recognition software, some of which were unable to recognize non-White faces as faces. Similar examples continue to occur, though there is increased awareness around this issue of data equity (Klare et al. 2012) and other forms of algorithmic bias. This awareness is also becoming more sophisticated, matching the complexity of the process itself. Extending our example, what if certain demographic groups have more prominent or distinctive facial features? If so, the model will be inherently more capable of identifying those individuals, which means we need training data sets that overrepresent groups whose faces are harder for the computer to learn. Whatever the application of machine learning or AI, one must consider how a biased training data set will construct a data-driven model and associated systems that will embody that same bias.
The second concern is how we design the interactions between humans and AI systems, a debate that reveals multiple tensions. On the one hand, there is the danger of entrusting critical societal processes to computers, especially when we are incapable of fully understanding how the computers are coming to these conclusions. Science fiction authors have already provided us with all sorts of dystopic scenarios that could come of that. On the other hand, we have found that the computers are better than humans at lots of tasks that we assume require specialized expertise. When built properly, machine learning models are more accurate and less biased at predicting places that are at-risk for crime, criminal defendants who are likely to reoffend, children who are likely to experience child abuse, and even driving cars in standard situations. But how comfortable are we replacing crime analysts, judges, social workers, and drivers with computers? And what are the economic consequences? These are the transformative questions that AI forces us to consider.
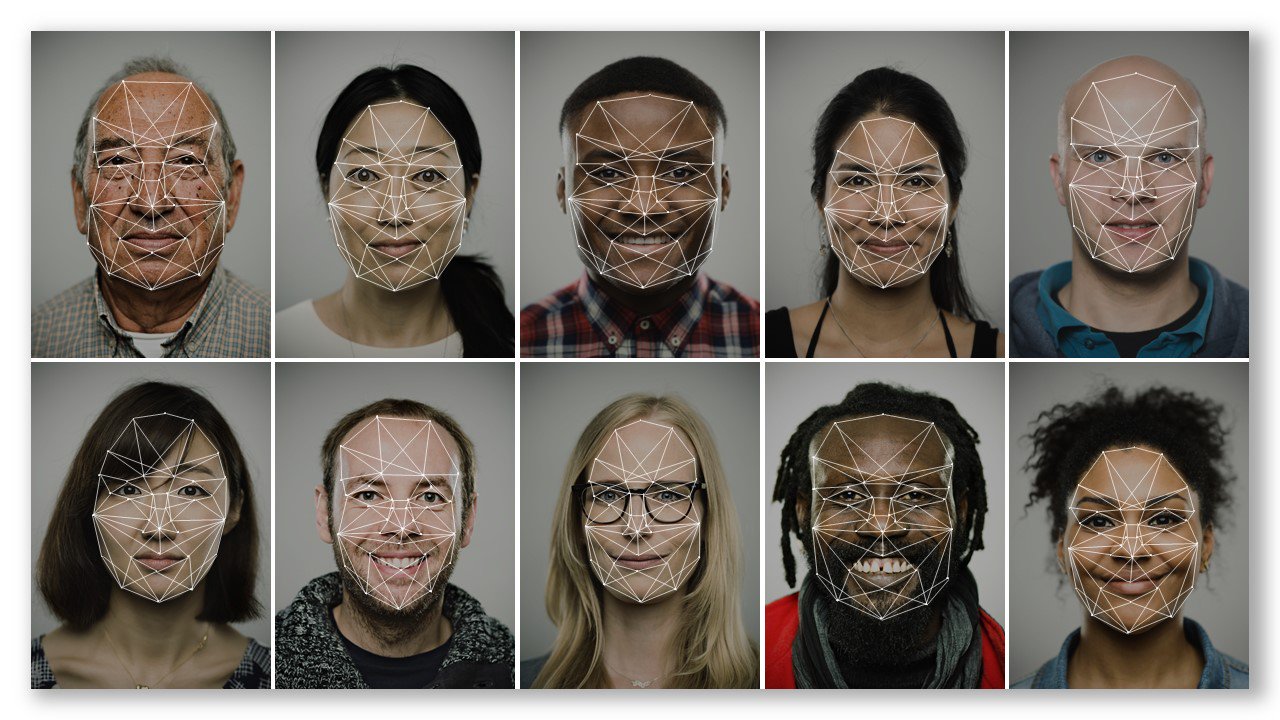
Figure 13.4: Facial recognition depends on a computer identifying the geometry of a face through a variety of visual “features”. These precise features may differ, however, by sex, race, age, and culture, requiring a diverse training data set for any such technology to be developed and implemented equitably. (Credit: Microsoft).
13.3.5 Major Applications
Machine learning and AI can be applied to a variety of subjects in cities and communities. Some are straightforward and benign, like the use of AI to interpret open text 311 reports and classify them by the type of services needed. This is a rather simple, Alexa-like improvement that allows an existing system to be more flexible in how it receives and responds to communities and their needs. Others are more complex, like autonomous vehicles. Despite some persistent limitations to the technology—it turns out that some of the many events that a driver might experience are difficult for a computer to learn, such as the effects of snowfall—but we are not far off from a world in which autonomous vehicles are safer drivers than most humans. What that will mean for transportation infrastructure is yet to be seen.
The applications that raise the greatest concerns are the ones that touch sensitive parts of our lives. By accessing increased complexity, AI unlocks the potential to do a lot of things for which we do not currently have rules because we never imagined them possible, and some of them will inevitably invade our privacy by using data to reveal our individuality. Facial recognition is now at the point that unique individuals can be identified. This can be highly invasive and can give law enforcement, for example, an unprecedented amount of power. Numerous communities around the United States have consequently decided to ban law enforcement from using facial recognition software. Additionally, as we will explore in Section 13.4 on predictive analytics, there are some hesitations for AI systems that direct human resources, especially in the criminal justice system.
13.3.6 Additional Reading
Public Policy Analytics: Code and Context for Data Science is a nice complement to this book in that it applies machine learning to public policy-oriented questions (2021, Chapman Hall / CRC Press).
R has a multitude of packages for machine learning, including a few we have already seen in this book, such as tm for text mining. Some of the other recommended ones are CARAT, which is especially made for training and testing processes, randomForest for random forest analyses, and neuralnet for running neural networks (though you may want to try some simpler techniques before making this leap).
13.4 Predictive Analytics
13.4.1 What It Is
In the 2002 movie Minority Report, Tom Cruise played a police officer whose “partners” were clairvoyants who could see the future and foretell the next crime. He and other members of the police department would use these prophecies to detain would-be perpetrators before the crime occurred. This aspiration of precise prevention has long been a dream of practitioners. If only we knew what was going to happen, we could be proactive instead of reactive. We have become increasingly adept at this for weather, for example, where we can anticipate events days in advance. For a lot of social phenomena, it has been more difficult, but many institutions are still working hard to develop predictive analytic systems that can be incorporated into daily and long-term processes.
13.4.2 How It Works
Predictive analytics is not really a new analytic technique in the way that network science or machine learning is. Instead, it is more of a shift in how all of the other statistical techniques are used. Whereas Unit 3 in this book used “prediction” to mean “explaining variation in a dependent variable,” here the word takes on its more forward-looking meaning. It does so by taking statistical models built on the past to forecast future events and conditions. This is very similar to the idea of testing machine learning models after training or incorporating machine learning models into AI. It is also perfectly possible with simpler techniques, such as regression. We can take the parameters of the original model, enter values for new cases, and see what the model suggests.
Let us use the real-world version of the Minority Report example. Predictive policing has become very popular over the last decade or so. It leverages highly detailed models to forecast where crime is likely to occur. Most often, these models are based largely on land use patterns (e.g., a bar is more likely to generate a violent assault than a church or a single-family house) and previous crimes (i.e., events tend to recur at the same or nearby places), as well as weather and other circumstantial factors. A predictive policing algorithm then takes all the variables of interest for today, enters them into the model, and reports out the places most likely to experience a crime.
13.4.3 When to Use It
The answer to the question of when to use predictive analytics is pretty simple: when you want to anticipate something and, presumably, proactively respond to or prepare for it. Similar to machine learning, building a predictive system requires a large historical data set to ensure that the model is strong enough to make meaningful predictions. Often, the construction of the model leverages machine learning techniques. That said, even large amounts of data are sometimes insufficient for a predictive model to be as accurate or precise as we might prefer, as we will explore in Section 13.4.4.
13.4.4 Ethical Considerations
Predictive analytics has generated lots of debate. One of the major issues is a specific extension of a concern described above for machine learning and AI: “garbage in, garbage out.” In this case, the output is a decision-making system. Predictive policing has been subject to this critique. It is well established that, in many parts of the United States, if the same potentially criminal event were to occur in a predominantly Black neighborhood and a predominantly White neighborhood, the former is more likely to result in an arrest. As a result, crime records are a racially biased representation of where crimes occur, overemphasizing Black communities. (Similar biases exist for other racial minorities and for low socioeconomic status.) If we were to then use crime records to predict where the next crime was likely to occur and deploy police accordingly, we would be perpetuating that same racial bias. This is a major problem, and no one has solved it in the case of predictive policing. Similarly, a major algorithm used to predict individual offenders was removed from use because, after further scrutiny, it was predicting ethnicity as much as it was predicting offending.
There are three additional concerns that are specific to predictive analytics and their applications:
- Precision. In Minority Report, the date, time, place, and perpetrator were spelled out in detail. We often like to hope that predictive analytics can reach this level of specificity, but in reality we fall far short. Rarely can we realize the same precision in space and time. Can we predict which neighborhoods will have the most crime next year? Definitely. Can we predict which household will experience a crime tomorrow? No. Of course, we can build risk models that tell us which places are more likely to experience crime in the near future, but we have to respect the limitations of our models and operate accordingly.
- Implementation. Once we know the strengths and limitations of our predictive model, we need to design the action that it instigates. This follow-up is often ignored in discussions of predictive analytics. This has been a critique in predictive policing as well, with many asking, once we have the model, what do we do with the information it generates? Some preliminary studies suggest that deploying police officers to pass through at-risk areas can in fact diminish crime, potentially by deterring delinquent individuals or interactions (Ratcliffe et al. 2021). But we also need to design these implementations with a respect for how precise of predictions we are actually able to make, per the previous concern.
- What if the prediction is wrong? This is a tricky philosophical issue for predictive analytics. It is great if we can anticipate events and respond to them appropriately. But if the prediction is wrong, which it will be at times, what are the consequences? I tend to think of this in terms of whether the action instigated by the prediction could help or harm. I was part of a project that helped Boston Public Schools redistribute funds according to predicted academic achievement. In this case, errors in prediction would result in more funds supporting certain students. Those students were not harmed in the process. If a predictive policing algorithm instigates a wrongful arrest, that is a much more troubling error. This means that we need to be exceptionally careful with predictive models that would inform actions that could harm someone and consider how to design implementation that is sensitive to these risks.
13.4.5 Major Applications
There are lots of applications for predictive analytics, some of which are illustrated in Figure 13.5. In a sense, any situation in which an institution is using past data to anticipate future events or conditions is predictive analytics. We might group them into two categories, though there are likely applications that do not fit neatly into either of these groupings. First, lots of predictive analytics algorithms seek to anticipate events. Predictive policing is one of the most prominent examples. There are related models for predicting offending in individuals or reoffending in parolees. There are also similar models for house fires and other destructive events.
A second class of algorithms seeks to anticipate the need for human services. For example, Allegheny County in Pennsylvania has used the vast contents of their Integrated Data System (IDS; see Chapter 7) to predict which calls to child protective services are most likely to portend actual child abuse. Similar models based on IDSes attempt to foresee homelessness and other conditions that will require government support or intervention. As noted in Section 13.4.4, in all of these cases there is the need to tailor action following the results of the model to the overall accuracy of the model and the potential benefit or harm of the eventual intervention.
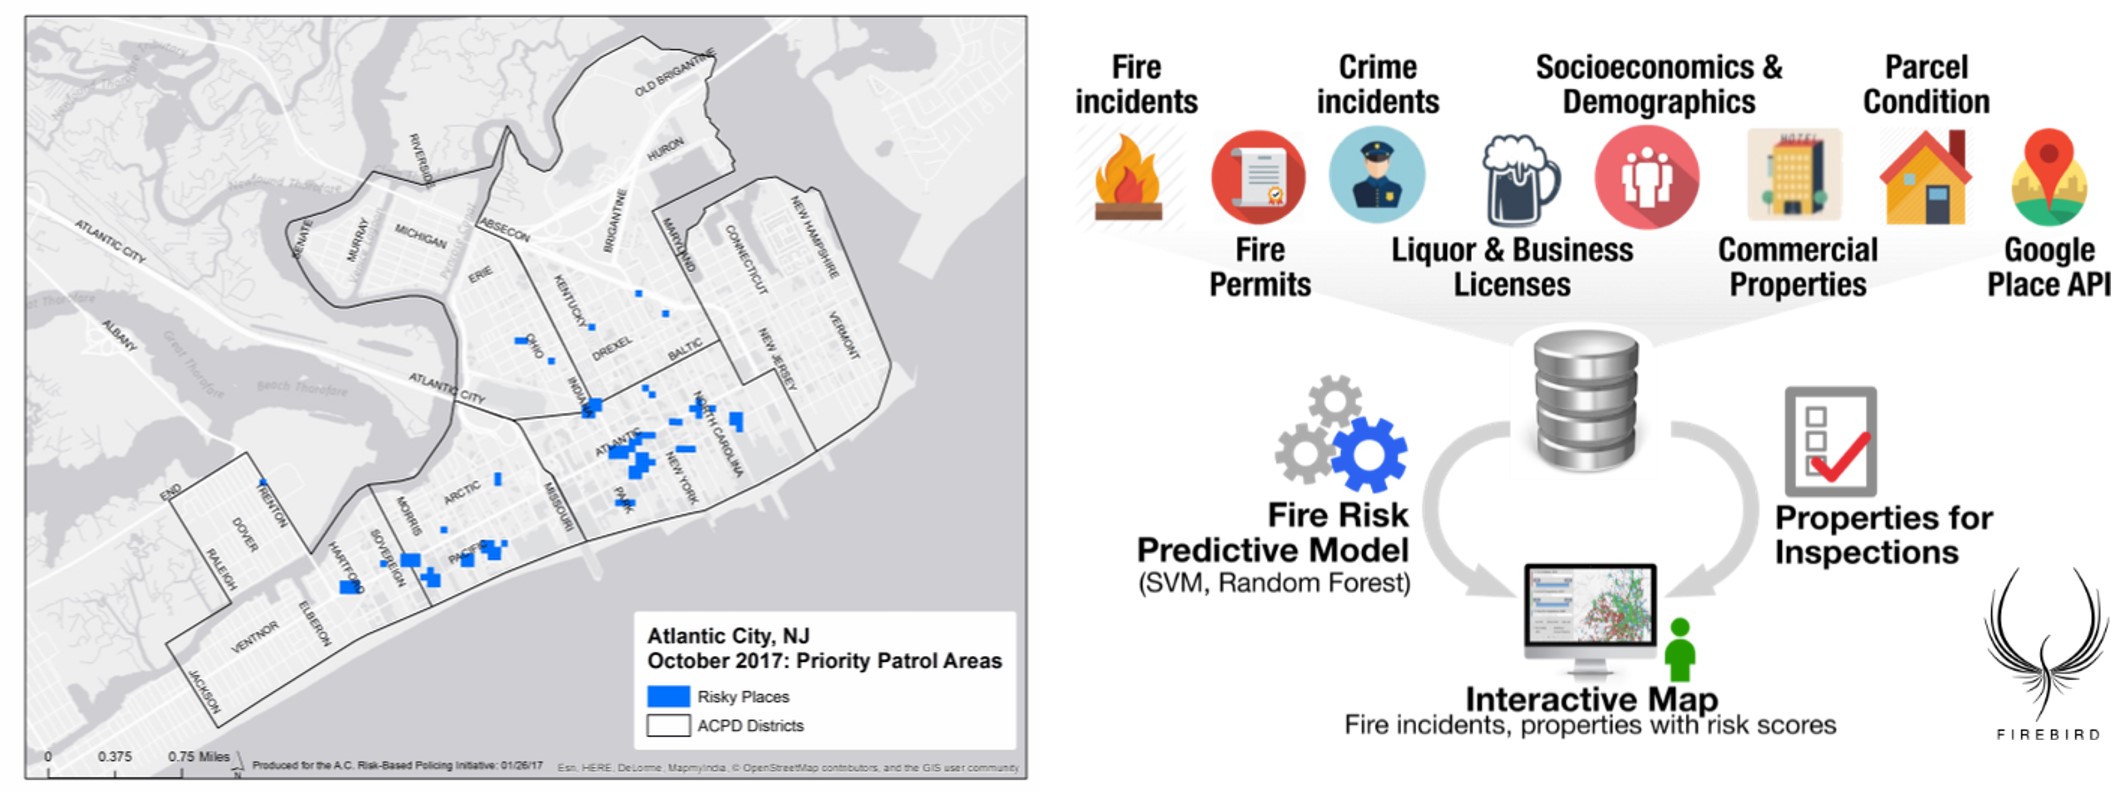
Figure 13.5: Predictive analytics can be applied to multiple use cases. Some of the most familiar include predicting places that are at risk for crimes, or “risky places,” in this example that uses past crime events and land use to model the “risk terrain” (left); and coordinating dozens of data sources describing events and context to predict where fires will occur (right). (Credit: https://www.riskterrainmodeling.com/blog; https://firebird.gatech.edu/)
13.4.6 Additional Reading
Foundations of Predictive Analytics by James Wu and Stephen Coggeshall walks through many of the techniques described in this chapter and their application to prediction (2012, Chapman Hall / CRC Press).
Applied Predictive Analytics by Dean Abbott describes how to use analytics to predict business processes. Admittedly it is focused on business-based applications. (2014, Wiley Publishing).
13.5 Summary
In this chapter we have learned about three advanced analytic techniques that are increasingly used in urban informatics. We have learned how they work, when to use them, as well as ethical considerations and major applications. These include:
- Network science, or the analysis of the ways in which people, places, and things are linked to each other;
- Machine learning and artificial intelligence, or techniques that allow the computer to determine the analytic model and its extensions;
- Predictive analytics, or the use of analytic models to forecast future events and conditions.
The goal here was not to make you an expert just yet, but to expose you to the basic knowledge needed to meaningfully discuss these tools and their applications, as well as enable you to go out and learn more about them.
13.6 Exercises
13.6.1 Problem Set
- For each of the following pairs of terms, distinguish between them and their roles in analysis.
- Machine learning vs. artificial intelligence
- Inferential statistics vs. machine learning
- Inferential statistics vs. predictive analytics
- Traditional statistics vs. network science
- For each of the three techniques learned in this chapter, summarize what you think is the most important ethical concern.
- For each of the three techniques learned in this chapter, research and describe one additional application.
13.6.2 Exploratory Data Assignment
Research a particular application of one of the three analytic techniques presented in this chapter (or that combines two or more of them). Write a short memo that describes:
- The purpose of the policy, program, service, or product.
- How it uses the technique (or techniques) in question.
- How it does or does not address potential ethical considerations.
- How well the technique has been applied to this situation.